Running a business involves making decisions every day.
How much should you spend on marketing? Which products are performing best? Are sales actually growing? Is the business profitable? Where is cash being spent? Which expenses need to be controlled?
Without reliable data, many of these decisions become guesses.
This is where business analytics becomes valuable.
Business analytics helps business owners, managers, entrepreneurs, and professionals turn financial and operational data into useful information that can support better decisions.
You don’t necessarily need expensive software or a large analytics team to get started. For many small businesses, a well-structured Excel dashboard, a few important KPIs, and a consistent reporting process can provide a strong foundation for data-driven decision making.
What Is Business Analytics?
Business analytics is the process of collecting, organizing, analyzing, and interpreting business data to understand performance and support better decisions.
Business data can include:
- Sales revenue
- Operating expenses
- Profit and loss
- Cash flow
- Customer information
- Product performance
- Marketing results
- Inventory
- Accounts receivable
- Accounts payable
- Employee costs
- Budget versus actual performance
The goal is not simply to collect numbers.
The goal is to understand what the numbers are telling you.
For example, knowing that monthly revenue is $50,000 is useful.
But understanding that:
- Revenue increased 15%
- Gross margin decreased 4%
- Marketing expenses increased 25%
- One product generated 60% of sales
- Cash flow declined despite higher revenue
provides much more actionable information.
This is the difference between simply recording business data and actually using analytics.
Why Business Analytics Matters for Small Businesses
Large companies often have dedicated finance, data, and business intelligence teams.
Small businesses usually don’t.
The business owner, manager, or finance professional may be responsible for tracking everything from sales and expenses to cash flow and profitability.
That makes having a simple analytics system even more important.
1. Make Better Business Decisions
Data can help replace assumptions with evidence.
Instead of asking:
“I think sales are improving.”
You can ask:
“How much did sales increase compared with the previous month and the same period last year?”
Instead of:
“Our expenses seem high.”
You can identify exactly which expense categories are increasing and by how much.
2. Understand Business Performance
A business may generate significant revenue while still struggling financially.
That’s why revenue alone isn’t enough.
Business analytics allows you to examine multiple performance indicators together, including:
- Revenue
- Gross profit
- Net profit
- Profit margin
- Operating expenses
- Cash flow
- Customer growth
- Sales conversion
- Average transaction value
Looking at these metrics together provides a more complete picture of business health.
3. Identify Problems Earlier
One of the biggest advantages of regular reporting is that it can reveal problems before they become serious.
For example, you may notice:
- Revenue declining for three consecutive months
- Operating expenses increasing faster than sales
- Profit margins shrinking
- Cash balances falling
- Customer acquisition costs increasing
- Certain products becoming less profitable
Early visibility gives management more time to respond.
What Are Business KPIs?
Key Performance Indicators (KPIs) are measurable values used to evaluate how effectively a business is achieving its objectives.
The right KPIs depend on the type of business and its goals.
However, many businesses can benefit from tracking a core group of financial and operational metrics.
Common Financial KPIs
Some important financial KPIs include:
Revenue
Measures the income generated from business activities.
Gross Profit
Shows revenue remaining after direct costs.
Net Profit
Shows how much profit remains after expenses.
Gross Profit Margin
Measures gross profit as a percentage of revenue.
Net Profit Margin
Measures net profit as a percentage of revenue.
Operating Expenses
Tracks the costs required to operate the business.
Cash Flow
Shows how cash moves into and out of the business.
Budget Variance
Compares actual performance against the planned budget.
Why a Business KPI Dashboard Is Useful
A business can have hundreds or thousands of individual data points.
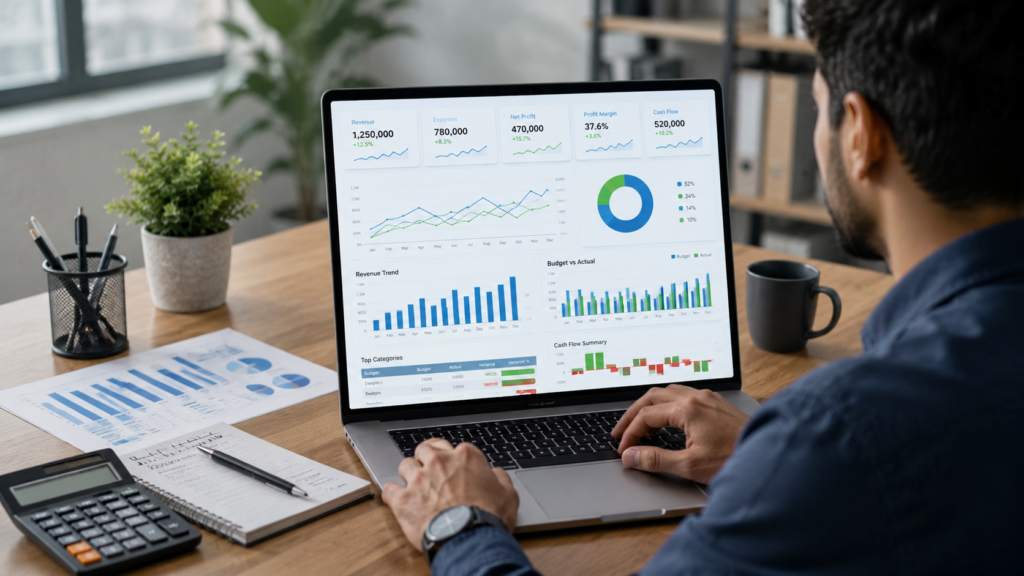
A dashboard helps summarize the most important information in one place.
Instead of reviewing multiple spreadsheets every time you want to understand business performance, a dashboard can provide a high-level view of important KPIs.
A useful business dashboard may include:
- Total revenue
- Total expenses
- Gross profit
- Net profit
- Profit margins
- Sales trends
- Expense trends
- KPI performance
- Monthly comparisons
- Budget versus actual results
The objective is simple:
Make important business information easier to understand and act upon.
Financial Analytics: More Than Just Profit
Profit is important, but it is only one part of financial performance.
A business can be profitable on paper and still experience cash-flow problems.
That’s why financial analytics should consider several areas.
Profitability
Profitability analysis helps answer questions such as:
- How profitable is the business?
- Which products generate the highest margins?
- Are expenses growing faster than revenue?
- Is profitability improving over time?
Cash Flow
Cash-flow analysis helps answer:
- How much cash is coming into the business?
- Where is cash being spent?
- Are there upcoming cash shortages?
- Is the business generating enough operating cash?
Budgeting
Budget analysis compares expected results with actual performance.
For example:
| Metric | Budget | Actual | Variance |
|---|---|---|---|
| Revenue | $50,000 | $54,000 | +$4,000 |
| Operating Expenses | $20,000 | $23,000 | -$3,000 |
| Net Profit | $15,000 | $14,000 | -$1,000 |
This immediately highlights an important issue.
Revenue exceeded the budget, but expenses increased enough to reduce the expected profit.
Without variance analysis, that problem could easily be overlooked.
How Excel Can Support Business Analytics
You don’t always need complicated business intelligence software to begin analyzing business performance.
Microsoft Excel remains a practical tool for many small businesses because it can be used for:
- Data entry
- Financial tracking
- Budgeting
- Forecasting
- KPI calculations
- Financial statements
- Charts
- Dashboards
- Variance analysis
- Scenario analysis
A properly designed Excel workbook can bring multiple analytical functions together in one system.
For businesses that are still developing their reporting processes, Excel can be an accessible starting point.
From Raw Data to Business Insights
A simple analytics process can follow four stages.
Step 1: Collect the Data
Gather relevant information such as:
- Sales
- Expenses
- Transactions
- Customer data
- Cash movements
- Budgets
Step 2: Organize the Data
Structure the information consistently.
For example, financial transactions can be categorized by:
- Date
- Account
- Category
- Description
- Amount
- Department
- Product
Step 3: Analyze the Data
Calculate important metrics and identify trends.
Look for:
- Growth
- Declines
- Variances
- Patterns
- Unusual changes
- Profitability differences
Step 4: Take Action
Analytics becomes valuable when it leads to decisions.
For example:
Finding: Marketing expenses increased 30%.
Analysis: Customer acquisition increased only 5%.
Decision: Review marketing channels and reduce spending on low-performing campaigns.
This creates a continuous cycle:
Data → Analysis → Insight → Decision → Action
10 Business Metrics Every Small Business Should Consider Tracking
Depending on the business model, these metrics can provide a useful starting point:
- Revenue
- Revenue Growth Rate
- Gross Profit
- Gross Profit Margin
- Net Profit
- Net Profit Margin
- Operating Expenses
- Operating Cash Flow
- Budget Variance
- Accounts Receivable
The important point is not to track every possible metric.
Instead, identify the KPIs that directly connect to your business objectives.
Common Business Analytics Mistakes
Tracking Too Many Metrics
More data doesn’t automatically mean better decision making.
A dashboard containing dozens of KPIs can become difficult to interpret.
Focus on the metrics that matter most.
Looking at Revenue Alone
Revenue growth does not necessarily mean profitability is improving.
Always consider revenue alongside costs, margins, and cash flow.
Updating Data Irregularly
Analytics loses value when information is outdated.
Establish a consistent reporting schedule, whether weekly or monthly.
Ignoring Variances
A budget is only useful when actual results are compared against it.
Variance analysis can reveal where performance differs from expectations.
Building Complicated Dashboards
A dashboard should simplify information, not make it more complicated.
Prioritize clarity, consistency, and actionable insights.
How to Build a Simple Business Analytics System
A practical starting system can be built around five components.
1. Transaction Data
Maintain organized records of business transactions.
2. Financial Reports
Track important financial statements and summaries.
3. KPI Tracking
Identify the most important business metrics.
4. Dashboard
Create a visual summary of key performance indicators.
5. Regular Review
Review the information consistently and use it to guide decisions.
This creates a repeatable management process instead of relying on occasional spreadsheet reviews.
Business Analytics Should Lead to Action
The purpose of analytics is not to create attractive charts.
It is to improve decision making.
For example:
Analytics: Gross margin decreased from 42% to 36%.
Question: Why?
Analysis: Product costs increased while selling prices remained unchanged.
Action: Review supplier pricing and evaluate product pricing.
Another example:
Analytics: Cash balance is declining despite increasing sales.
Question: Why?
Analysis: Customers are taking longer to pay invoices.
Action: Improve collections and review payment terms.
This is where business analytics becomes a management tool rather than simply a reporting exercise.
Final Thoughts
Business analytics doesn’t have to be complicated.
For many small businesses, the foundation can be surprisingly simple:
Track the right data.
Measure the right KPIs.
Understand the trends.
Compare actual performance with expectations.
Take action based on the findings.
An organized Excel dashboard can provide a practical starting point for businesses that want better visibility into their financial and operational performance.
As the business grows, the analytics system can grow with it.
The ultimate goal is not to have more spreadsheets or more numbers.
The goal is to have better information for better business decisions.
Explore Business Analytics Resources from BizAnalyticsMBA
At BizAnalyticsMBA, we create practical business analytics and financial tools designed to help entrepreneurs, small business owners, managers, finance professionals, and students organize data and understand business performance.
Explore our collection of Excel business dashboards, financial trackers, KPI tools, budgeting templates, and business analytics resources to build a more structured approach to business reporting and decision making.
Turn your business data into insights. Then turn those insights into action.
FAQ
What is business analytics for small businesses?
Business analytics for small businesses involves collecting, organizing, analyzing, and interpreting business data to understand performance and make better decisions.
What KPIs should a small business track?
Common KPIs include revenue, revenue growth, gross profit, gross margin, net profit, net profit margin, operating expenses, cash flow, and budget variance.
Can Excel be used for business analytics?
Yes. Excel can be used for financial tracking, KPI calculations, budgeting, forecasting, dashboards, variance analysis, and other business analytics activities.
What is a business KPI dashboard?
A business KPI dashboard is a centralized view of important performance metrics that helps management quickly understand business performance and identify trends or problems.
Why is financial analytics important?
Financial analytics helps businesses understand profitability, expenses, cash flow, financial trends, and budget performance so management can make more informed decisions.
How often should a business review its KPIs?
The ideal frequency depends on the business. Many businesses benefit from weekly operational monitoring and a more detailed monthly financial review.
Is business analytics only for large companies?
No. Small businesses can also benefit from analytics. In fact, simple and consistent KPI tracking can help small businesses identify problems and opportunities earlier.
What is the difference between business analytics and business intelligence?
Business analytics generally focuses on analyzing data to understand performance, identify patterns, and support decisions. Business intelligence often emphasizes reporting, dashboards, and structured access to business information. The terms can overlap depending on the context.